Everything you ever wanted to know about presidential margins of victory
The 2016 presidential election sparked considerable interest in margins of victory in presidential contests. President Trump and his team claimed that his margin of victory was “massive.” Politifact did an excellent job debunking that claim using data from political scientist John J. Pitney. The Washington Post also did a great job covering this, as well as Nate Silver at 538.
This post covers some of the same ground as those listed above, but is directed to all of the presidential elections, not just 2016. I compiled all the data for each presidential election, including electoral college and popular vote numbers, from UC Santa Barbara’s excellent “The American Presidency Project.” What follows are some interesting data on margins of victory in presidential elections.
What is a margin of victory?
Before we dive into the data, it’s important to clarify what is meant by “margin of victory.” A margin of victory is the difference in votes received between candidates for office. The election of the president of the United States is determined by whoever wins the majority of electoral college votes, but as a society we also track the number of popular votes candidates receive. As such, both the electoral college and the popular vote are covered in this post.
Comparing margins of victory across the years requires defining the margin of victory in terms that can be applied across the years. You can’t just compare the raw numbers, because the population has changed over the years. Accordingly, it makes sense to calculate the margin of victory in terms of the percentage difference between the winner and the runner-up.
Since the winner of the Presidency is decided by the Electoral College we’ll start by looking at the data concerning electoral college votes, then the popular vote, and then a combination of both electoral college and popular vote.
Electoral College Data
To win the Presidency a candidate must win a majority of the electoral college votes at stake. Today, a majority consists of winning at least 270 electoral college votes. So, what does the data show? Well, the average electoral college margin of victory is 44.6%, and the median electoral college margin of victory is 39.2%. Yes, but how do the president’s stack up against each other? The chart below lists the presidents from largest electoral college margin of victory to smallest electoral college margin of victory.
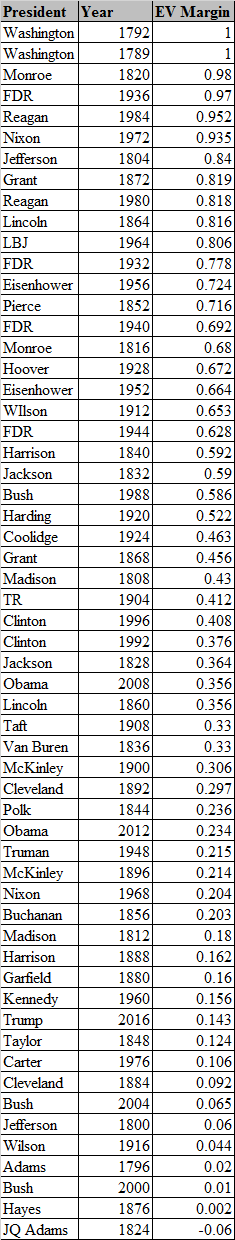
The first thing that jumps out about this chart is George Washington’s unopposed victories. If you were not already aware, in both elections President Washington won every single electoral vote, however, Washington was not the only candidate considered.
Right up there with Washington is Reagan, FDR, and perhaps surprisingly, Nixon. Throw in James Monroe and you have the only presidents to have an electoral college margin of victory above ninety percent. The president with the closest electoral college victory to the average electoral college victory? Ulysses S. Grant with a 45.6% margin of victory. The president closest to the median electoral college victory? Bill Clinton. Both times. In 1992 with a margin of 37.6%, and in 1996 with a margin of 40.8%.
On the opposite end of the spectrum you have the slimmest electoral college winners: Woodrow Wilson with 4.4% in 1912, John Adams with 2% in 1796, George W. Bush with 1% in 2000, Rutherford B. Hayes with 0.2%, and John Quincy Adams with -6% in 1824. Yes, John Quincy Adams won the Presidency after losing the electoral college, and the popular vote. The election of 1824 was quite the mess.
Popular Vote Data
We as a country did not track the popular vote until the election of 1824. The winner of the popular vote is not the winner of the Presidency, as Hillary Clinton, Al Gore, Grover Cleveland, Samuel Tilden, and Andrew Jackson can all attest.
Going over the same statistics as for the electoral college, the average popular vote margin of victory is 8.7%, and the median electoral college margin of victory is 7.5%. Again, how do all the president’s stack up against each other? The chart below lists the presidents from largest popular vote margin of victory to smallest popular vote margin of victory.
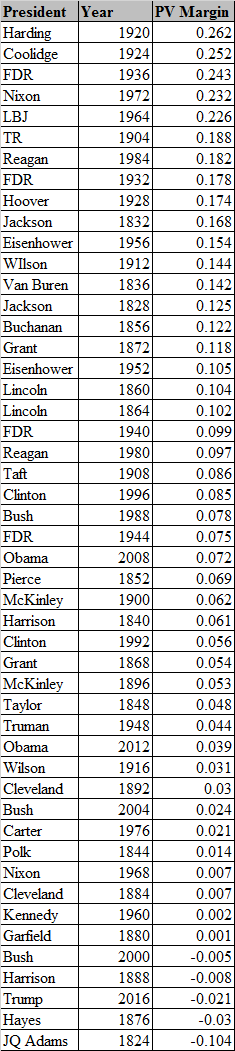
Take a bow if you had Warren G. Harding as the president with the largest popular vote margin of victory in US history. Bonus points if you had his right hand man “Silent Cal” as the runner-up. The top of the list also includes FDR, LBJ, and Nixon. William Taft has the closest margin of victory to the average margin of victory with 8.6% in the election of 1908. The president closest to the median popular vote victory? FDR in 1944 when he was elected for the fourth time with a margin of 7.5%.
On the opposite end of the spectrum you have the five popular vote losers that won the presidency: George W. Bush with -0.5% in 2000, Benjamin Harrison with -0.8% in 1888, Donald Trump with -2.1% in 2016, Rutherford Hayes with -3% in 1876, and John Quincy Adams with -6% in 1824.
Combined Electoral College and Popular Vote
Why would we want to consider the combined electoral college margin of victory and popular vote margin of victory? Well, for one thing, the combination of the two is a better indicator of broad support behind a presidential victory. As we have seen, a candidate can win the electoral college, but lose the popular vote, and vice versa. If a candidate is one of the top performers in both the electoral college vote and the popular vote that is a good indicator of their support, but that is also a decent indicator of how successful their presidency may be, as well as whether they might be re-elected.
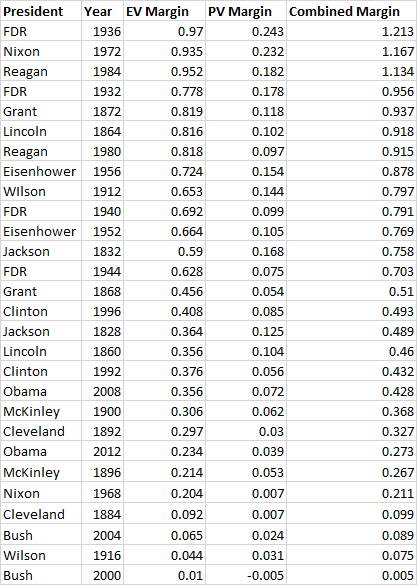
The average combined margin of victory is 50.9%, and the median combined margin of victory is 47.2%. Once again, how do all the president’s stack up against each other? The chart below lists the presidents from largest combined margin of victory to smallest combined margin of victory.
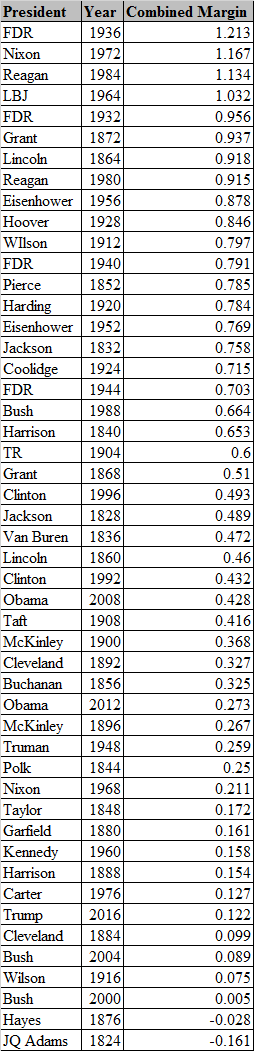
The top of the list includes FDR (twice), Nixon, Reagan, and LBJ. Ulysses S. Grant has the closest margin of victory to the average combined margin of victory with 51% in the election of 1868. The president closest to the median combined margin of victory? Martin Van Buren in 1836 with 47.2%.
On the opposite end of the spectrum you have the five weakest combined margins of victory: George W. Bush with 8.9% in 2004, Woodrow Wilson with 7.5% in 1916, George W Bush (again) with 0.5% in 2000, Rutherford Hayes with -2.8% in 1876, and John Quincy Adams with -16.1% in 1824.
There appears to be a correlation between performance in the electoral college and popular vote, which is illustrated by the chart below. The data is drawn from the tables above.
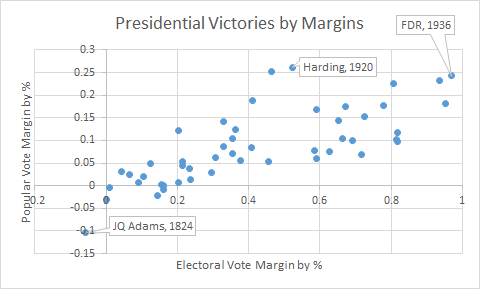
The chart above plots the combined margins of victory for each president from 1824 to 2016. The y-axis represents the popular vote margin of victory. The x-axis represents the electoral college margin of victory. Three presidents have been highlighted: FDR’s dominating election in 1936 is off in the upper right corner of the chart; Harding’s election in 1920 with the largest popular vote margin of victory, and JQ Adams abysmal performance in 1824 in the lower left of the chart. From the chart the relationship between electoral vote margin and popular vote margin means a 20% increase in electoral vote margin roughly translates to a 5% increase in popular vote margin. In fact, the slope of the trendline for the chart is .2149.
Another way to look at these combined margins of victories is chronologically. You can see large margins during times of war or periods of unrest. The bar chart below shows the combined margins of victory.
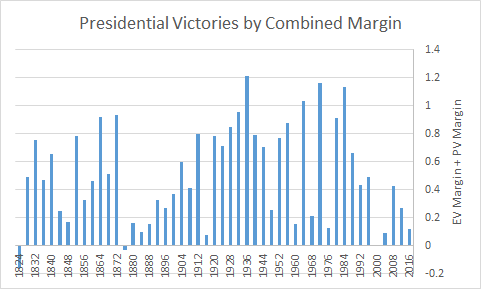
From this chart you can see that presidents seem to either do very well, or barely win election. Sixteen presidents have a combined margin of victory of 75% or higher, sixteen presidents have a combined margin of victory of less than 27%, and eight presidents have a combined margin of victory between 27% and 75%. You’re either popular, or not.
Two-Term+ Presidents
What about two-term+ presidents? Well, we’ve only had seventeen of those, and of those seventeen only thirteen were reelected after 1824, which is the cutoff point for our combined margin of victory statistic. The chart below shows each election that a two term+ president won including the initial election.
FDR dominates the upper right quadrants of this chart. GWB is two of the data points in the far lower left. The average popular vote margin of victory in elections that a two term+ president won is 9.4%, and the median is 9.1%. As for the average electoral vote margin of victory that is 49.3%, with a median electoral vote margin of victory of 43.2%. The following table shows all the data for reelected Presidents sorted by their combined margin of victory.
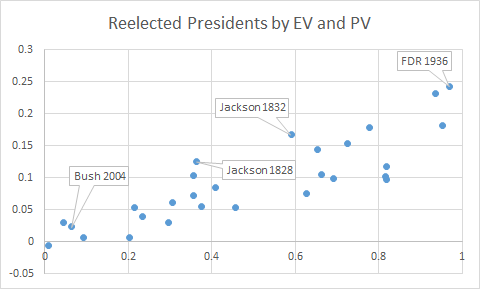
Again the most popular Presidents from before are at the top and there are no surprises at the bottom. The more meaningful data for reelected Presidents is how they did in their first election. That table is below, and a chart of the data below that.
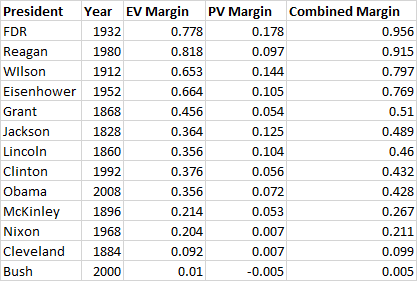
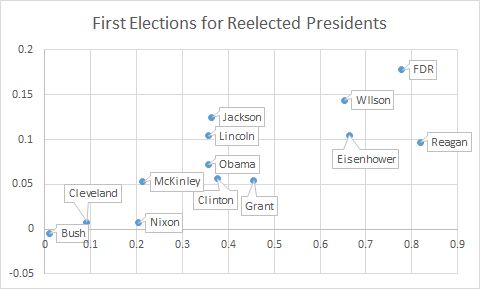
Four of the reelected Presidents have combined margins of victory over 75% (FDR, Reagan, Wilson, and Eisenhower), five of the reelected Presidents have combined margins of victory between 40%-75% (Grant, Jackson, Lincoln, Clinton, and Obama), and four reelected Presidents have combined margins of victory less than 40% (McKinley, Nixon, Cleveland, and GWB). GWB is the only President to have lost the popular vote and been reelected President. He won the popular vote in his reelection campaign.
Conclusion
What does it all mean? Well, it appears that Presidents either have a fairly strong margin of victory to get them elected, or not all that much. Regardless, the data is extremely clear that the sitting President’s victory is one of the weaker victories in our history.